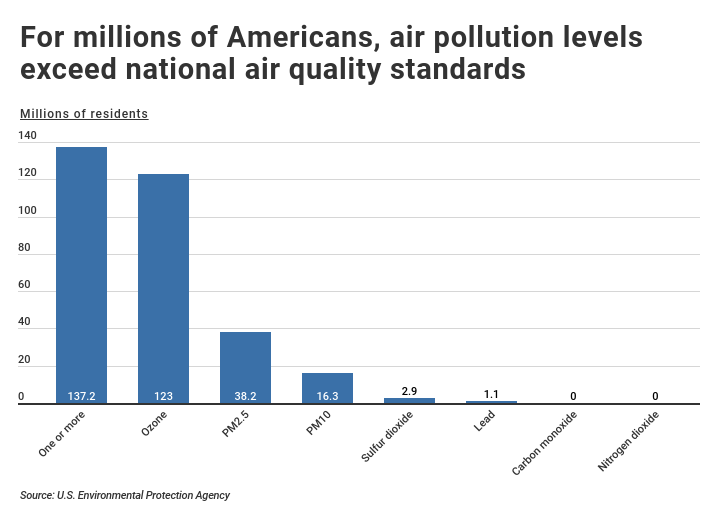
While air pollution in the U.S. has
improved remarkably since the passage of the Clean Air Act, the
Environmental Protection Agency (EPA) estimates that 137 million people nationwide still live in counties where air pollution levels exceeded air quality standards. In 2018, the U.S. emitted 76 million tons of pollution into
the atmosphere, which according to the American Lung Association,
contributes to increased rates of lung cancer and reduced lifespans
among American families.
Air
quality standards for common pollutants that pose a threat to public
health are managed by the EPA. These pollutants include ozone, fine and
coarse particulate matter (PM2.5 and PM10), sulfur dioxide, lead, carbon
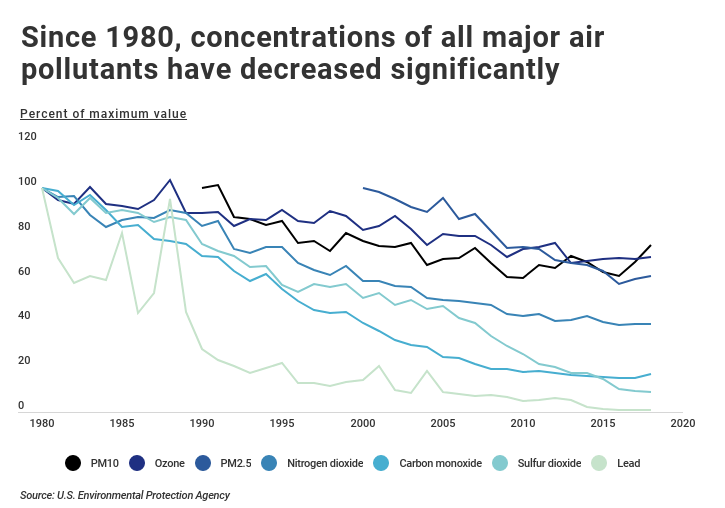
monoxide, and nitrogen dioxide. From 1980 to 2018, the greatest air
quality improvements occurred in lead, sulfur dioxide, and carbon
monoxide levels. According to the EPA,
efforts to remove lead from automobile gasoline alone helped reduce
levels of lead in the air by 89 percent over three decades. Similarly, a
1990 update to the Clean Air Act known as the Acid Rain Program set
a permanent cap on emissions of sulfur dioxide and nitrogen oxides from
power plants. The cap helped reduce sulfur dioxide to 9.0 percent of
the 1980 value and the level of nitrogen dioxide to 39 percent over the
same time period.
While
levels of nitrogen dioxide, carbon monoxide, sulfur dioxide, and lead
are all below 40 percent of their respective 1980 values, ozone and
particle pollution continue to present a major public health risk. With
these trends in mind, researchers at BuyAutoInsurance.com analyzed data from the EPA to find the U.S. metropolitan areas with the highest levels of air pollution.
The
EPA uses a measure known as the Air Quality Index (AQI) to report daily
air quality, with higher values corresponding to greater levels of air
pollution. Values between 0-50 are considered good; values between
51-100 are moderate; values between 101-150 are unhealthy for sensitive
groups; and values above 151 are unhealthy for the general public.
Researchers used AQI data to determine air quality rankings for small,
midsize, and large metropolitan areas.
The findings among the
small and midsize metros are in line with the findings among the large
metros. Specifically, locations in California make repeated appearances
on these lists. When comparing air pollution levels of large
metropolitan areas, five of the top 15 metros were found to exist in the
coastal state. The incidence is higher among the top 15 small and
midsize metros.
Here are the metropolitan areas with the worst air quality.
The 15 Large Metros With the Worst Air Quality
Photo Credit: Alamy Stock Photo
15. New York-Newark-Jersey City, NY-NJ-PA
Median AQI: 53
Max AQI: 210
Good air quality: 156 days per year
Moderate or unhealthy for sensitive groups: 206 days per year
Unhealthy, very unhealthy, or hazardous: 3 days per year
Most common pollutant: Fine particulate matter (PM2.5)
Photo Credit: Alamy Stock Photo
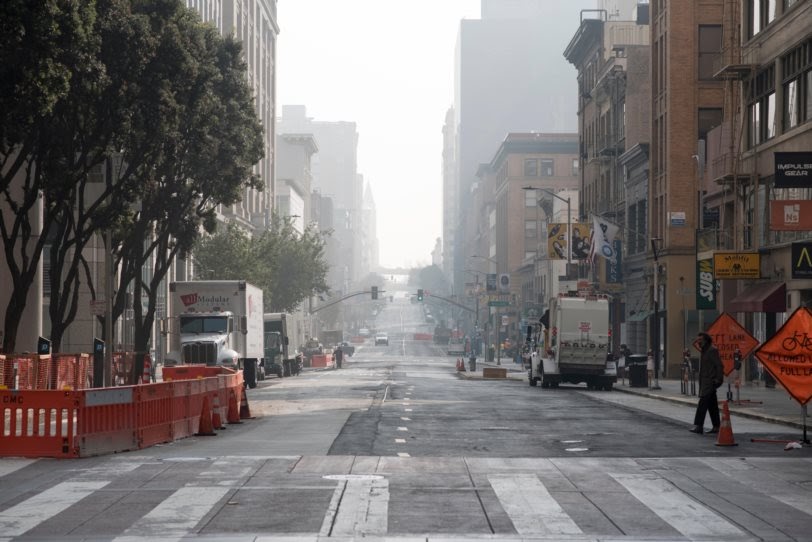
14. San Francisco-Oakland-Hayward, CA
Median AQI: 53
Max AQI: 245
Good air quality: 147 days per year
Moderate or unhealthy for sensitive groups: 206 days per year
Unhealthy, very unhealthy, or hazardous: 12 days per year
Most common pollutant: Fine particulate matter (PM2.5)
Photo Credit: Alamy Stock Photo
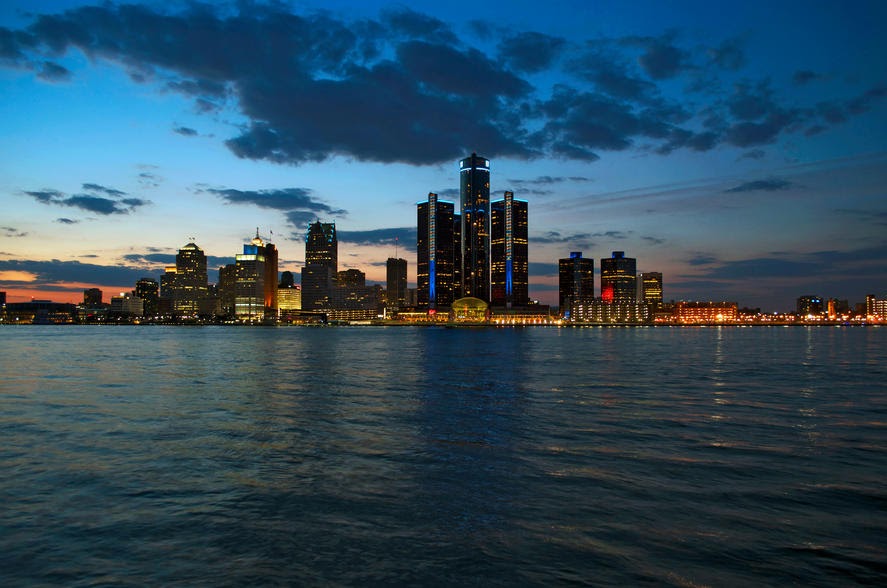
13. Detroit-Warren-Dearborn, MI
Median AQI: 54
Max AQI: 151
Good air quality: 137 days per year
Moderate or unhealthy for sensitive groups: 226 days per year
Unhealthy, very unhealthy, or hazardous: 2 days per year
Most common pollutant: Fine particulate matter (PM2.5)
Photo Credit: Alamy Stock Photo
12. St. Louis, MO-IL
Median AQI: 54
Max AQI: 182
Good air quality: 157 days per year
Moderate or unhealthy for sensitive groups: 206 days per year
Unhealthy, very unhealthy, or hazardous: 2 days per year
Most common pollutant: Fine particulate matter (PM2.5)
Photo Credit: Alamy Stock Photo
11. Pittsburgh, PA
Median AQI: 55
Max AQI: 154
Good air quality: 136 days per year
Moderate or unhealthy for sensitive groups: 228 days per year
Unhealthy, very unhealthy, or hazardous: 1 day per year
Most common pollutant: Fine particulate matter (PM2.5)
Photo Credit: Alamy Stock Photo
10. Philadelphia-Camden-Wilmington, PA-NJ-DE-MD
Median AQI: 55
Max AQI: 164
Good air quality: 132 days per year
Moderate or unhealthy for sensitive groups: 230 days per year
Unhealthy, very unhealthy, or hazardous: 3 days per year
Most common pollutant: Fine particulate matter (PM2.5)
Photo Credit: Alamy Stock Photo
9. Chicago-Naperville-Elgin, IL-IN-WI
Median AQI: 57
Max AQI: 177
Good air quality: 117 days per year
Moderate or unhealthy for sensitive groups: 242 days per year
Unhealthy, very unhealthy, or hazardous: 6 days per year
Most common pollutant: Fine particulate matter (PM2.5)
Photo Credit: Alamy Stock Photo
8. Las Vegas-Henderson-Paradise, NV
Median AQI: 61
Max AQI: 154
Good air quality: 122 days per year
Moderate or unhealthy for sensitive groups: 242 days per year
Unhealthy, very unhealthy, or hazardous: 1 day per year
Most common pollutant: Ozone
Photo Credit: Alamy Stock Photo
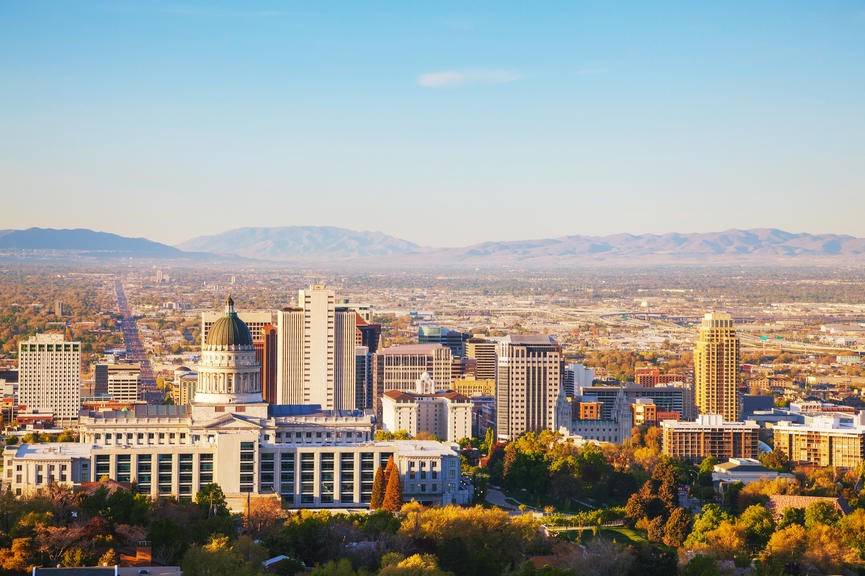
7. Salt Lake City, UT
Median AQI: 61
Max AQI: 169
Good air quality: 138 days per year
Moderate or unhealthy for sensitive groups: 225 days per year
Unhealthy, very unhealthy, or hazardous: 2 days per year
Most common pollutant: Ozone
Photo Credit: Alamy Stock Photo
6. Sacramento–Roseville–Arden-Arcade, CA
Median AQI: 61
Max AQI: 314
Good air quality: 124 days per year
Moderate or unhealthy for sensitive groups: 217 days per year
Unhealthy, very unhealthy, or hazardous: 24 days per year
Most common pollutant: Ozone
Photo Credit: Alamy Stock Photo
5. San Diego-Carlsbad, CA
Median AQI: 64
Max AQI: 143
Good air quality: 73 days per year
Moderate or unhealthy for sensitive groups: 292 days per year
Unhealthy, very unhealthy, or hazardous: 0 days per year
Most common pollutant: Ozone
Photo Credit: Alamy Stock Photo
4. Denver-Aurora-Lakewood, CO
Median AQI: 64
Max AQI: 174
Good air quality: 83 days per year
Moderate or unhealthy for sensitive groups: 274 days per year
Unhealthy, very unhealthy, or hazardous: 8 days per year
Most common pollutant: Ozone
Photo Credit: Alamy Stock Photo
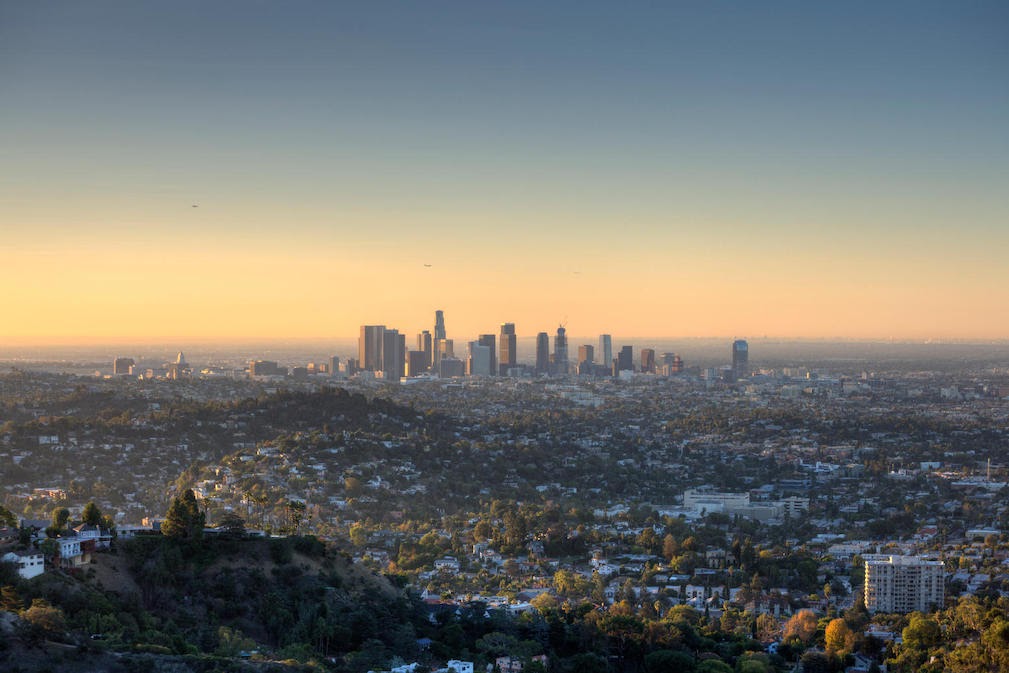
3. Los Angeles-Long Beach-Anaheim, CA
Median AQI: 77
Max AQI: 201
Good air quality: 35 days per year
Moderate or unhealthy for sensitive groups: 310 days per year
Unhealthy, very unhealthy, or hazardous: 20 days per year
Most common pollutant: Ozone
Photo Credit: Alamy Stock Photo
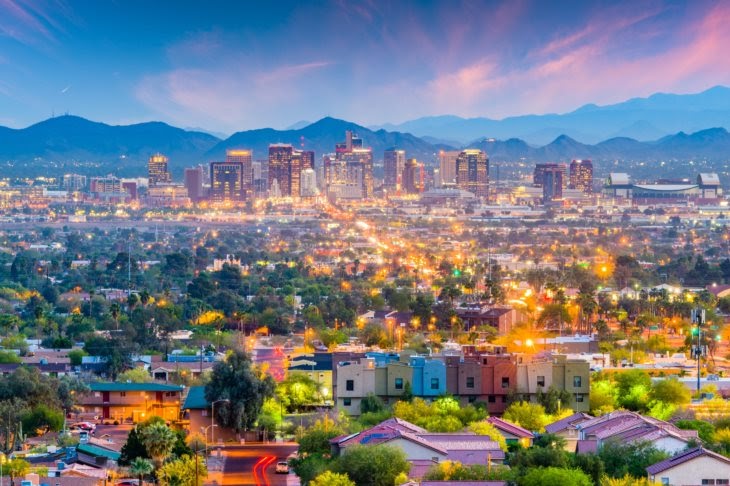
2. Phoenix-Mesa-Scottsdale, AZ
Median AQI: 77
Max AQI: 996
Good air quality: 42 days per year
Moderate or unhealthy for sensitive groups: 304 days per year
Unhealthy, very unhealthy, or hazardous: 19 days per year
Most common pollutant: Coarse particulate matter (PM10)
Photo Credit: Alamy Stock Photo
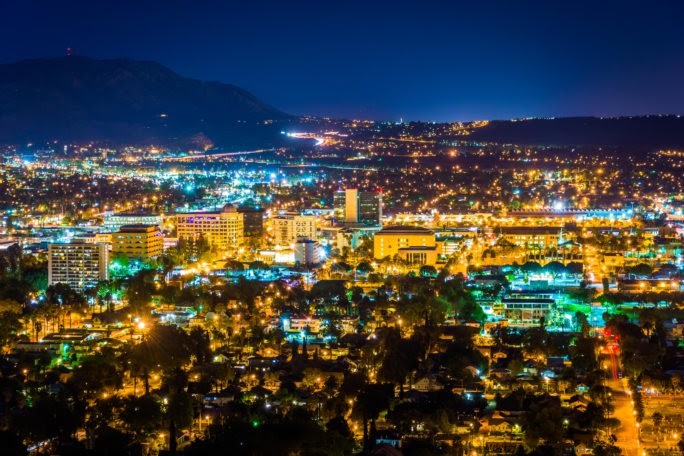
1. Riverside-San Bernardino-Ontario, CA
Median AQI: 97
Max AQI: 296
Good air quality: 25 days per year
Moderate or unhealthy for sensitive groups: 275 days per year
Unhealthy, very unhealthy, or hazardous: 65 days per year
Most common pollutant: Ozone
Methodology & Detailed Findings
Statistics on annual levels of air pollutants by metropolitan area for 2018 were obtained from the U.S. Environmental Protection Agency.
For each metro, the EPA calculates a daily index value for each
pollutant. The highest of those index values is reported as the daily
Air Quality Index (AQI) value, and the pollutant responsible for the
highest index value is considered the main pollutant for the day. For
each metro, the median of the daily AQI values is reported as the
overall measure of air quality for the year—the median AQI.
Additionally, for each metro, the pollutant listed as the main pollutant
for the greatest number of days in the year is listed as the most
common pollutant in that metro. PM10 and PM2.5 represent coarse and fine
particulate matter, respectively.
To improve relevance, metropolitan areas were grouped into the following cohorts based on population size:
Large: 1,000,000 or more
Midsize: 350,000-999,999
Small: 100,000-349,999
Metros
were ordered by their median AQI. In the event of a tie, both the
maximum annual AQI and the number of unhealthy, very unhealthy, or
hazardous days were considered.
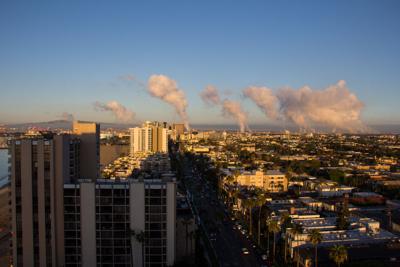
Many of America’s most polluted
metros are in California. The rankings can be attributed to a few
factors. First, California is the most populous U.S. state, which means
more people are commuting, consuming, and ultimately polluting. Second,
California is generally warm and sunny. Ground-level ozone pollution is
more likely to form in this type of climate as the sun and heat act as
accelerants. California’s hot weather has also been linked to severe
wildfires, which push more dangerous particles into the air. Finally,
many California cities exist on plains or in valleys that are encased by
mountains. This topography helps trap pollutants in, keeping ambient
air concentrations high.
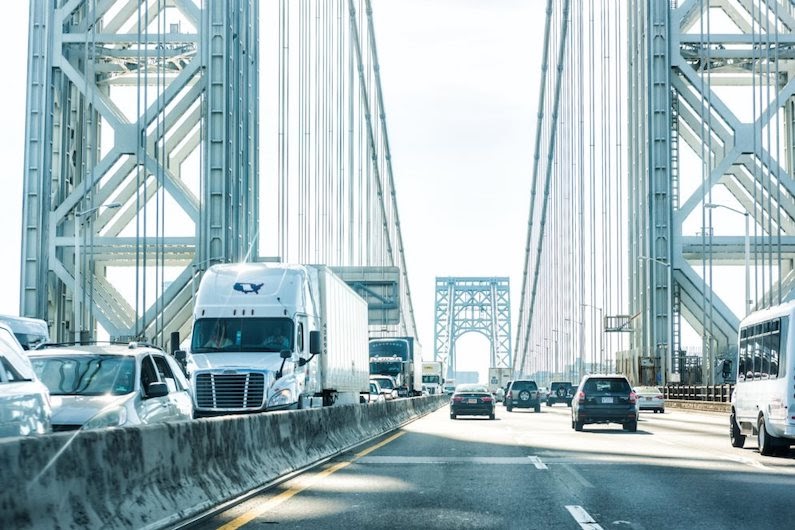
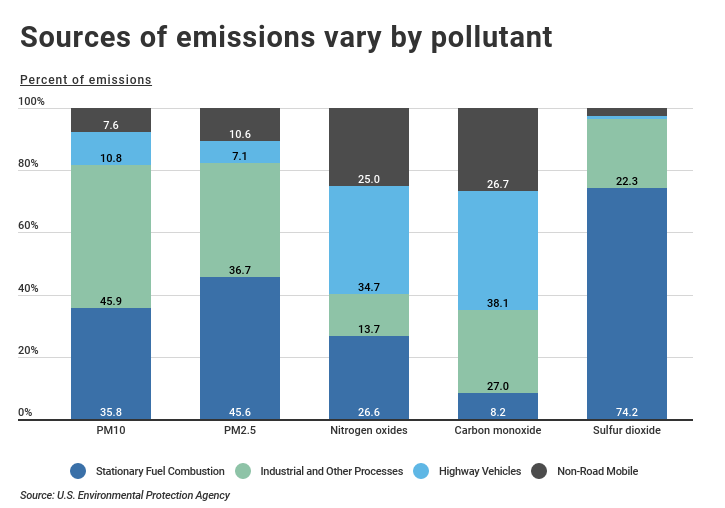
Across
the U.S., major sources of pollution vary by pollutant. For example,
vehicles produce the largest share of carbon monoxide gas, while
industrial processes and stationary fuel consumption (like power plants)
are responsible for the majority of particulate matter and sulfur
dioxide in the air.
Commonly, ground-level ozone pollution is
caused by automobiles, power plants, chemical plants, refineries, and
industrial boilers. However, it can also be created through natural
sources including trees. Prolonged exposure to this type of pollution
can lead to numerous health problems, particularly those related to the
lungs and respiratory system.
Air
pollution in the U.S. has greatly improved since the passage of the
Clean Air Act. Yet, millions of Americans continue to live in areas
where air pollution remains a threat. To tackle this ongoing problem,
the EPA and other federal, state, and local environmental agencies are
implementing new policies and programs aimed at individuals and
companies. For example, the EPA SmartWay program helps companies
identify more fuel-efficient ways to move goods. Similarly, cities and
states across the nation are heavily investing in and promoting public
transportation systems as a way to reduce air pollution and protect the
environment.
Population Panic John Stossel | Jan 25, 2023 Have you heard? The world is about to end! "60 Minutes" recently featured Paul Ehrlich, author of the bestseller, "The Population Bomb." "Humanity is not sustainable," he said. Why would "60 Minutes" interview Ehrlich? For years, Ehrlich said, "We are very close to a famine" and, "In the next 15 years, the end will come." He's been wrong again and again. Yet, "60 Minutes" takes him seriously. "Paul Ehrlich may have lived long enough to see some of his dire prophecies come true," intoned reporter Scott Pelley. Now, "60 Minutes" says, "scientists say" the earth is in the midst of a "mass extinction"! Doom sells. Ehrlich's book sold an amazing 3 million copies. It claimed the Earth's rising population would lead to worldwide famine. The opposite happened. The world's population more than doub...
The Recycling Religion John Stossel | Jan 18, 2023 Paul Sakuma For decades, we've been told: recycle! "If we're not using recycled paper, we're cutting down more trees!" says Lynn Hoffman, co-president of Eureka Recycling. Recycling paper (or cardboard) does save trees. Recycling aluminum does save energy. But that's about it. The ugly truth is that many "recyclables" sent to recycling plants are never recycled. The worst is plastic. Even Greenpeace now says, "Plastic recycling is a dead-end street." Hoffman often trucks it to a landfill. Years ago, science writer John Tierney wrote a New York Times Magazine story, " Recycling Is Garbage ." It set a Times record for hate mail. But what he wrote was true. "It's even more true today," says Tierney in my new video . "Recycling is an industry that uses increasingly expensive labor to produce materials that are worth less and less." It...
Giant 'Rivers' That Flow Through The Sky Mapped For First Time Environment 26 February 2024 By Tessa Koumoundouros Atmospheric rivers, filaments of intense moisture transport in the atmosphere, can now be automatically detected in satellite observations. (NOAA) Rivers of intense moisture wend their way through our atmosphere just as their liquid counterparts do across the land. Unfortunately the sky streams are much harder for us to see. Often a product of cyclones, atmospheric rivers can dictate where intense rain will fall , making their lack of visibility a problem. Understanding them grows increasingly important as our warming atmosphere soaks up even greater amounts of water, forcing these aerial waterways to change course . Until now, researchers relied on computer modeling to predict where this water vapor likely flows, but researchers have now devised a way for us to spy on them in real time. The missing piece of the puzzle was a 3D windscape....


Comments
Post a Comment